Bioclipse-R refers to the integration of the R statistical language in Bioclipse. If you use Bioclipse-R in your research, please cite:
Bioclipse-R: Integrating management and visualization of life science data with statistical analysis 2012 Nov 23. [Epub ahead of print] LINK TO ARTICLE |
Getting started
Window -> Show View -> Other... -> Scripting -> R Console will show the R console, where R code can be run interactively. Some example commands:
> 2+2 # Add numbers
 [1] 4
 > sin(pi/3) # Compute sinus of π/3
 [1] 0.8660254
 > x <- c(1,2,3,4,5,6) # Create a vector
 > y <- x^2 # Square the elements of x
 > y # print (vector) y
 [1] 1 4 9162536
 > plot(x, y) # Plots the vector x against y
 > ?plot # Get help about plot command (can be used with any command)
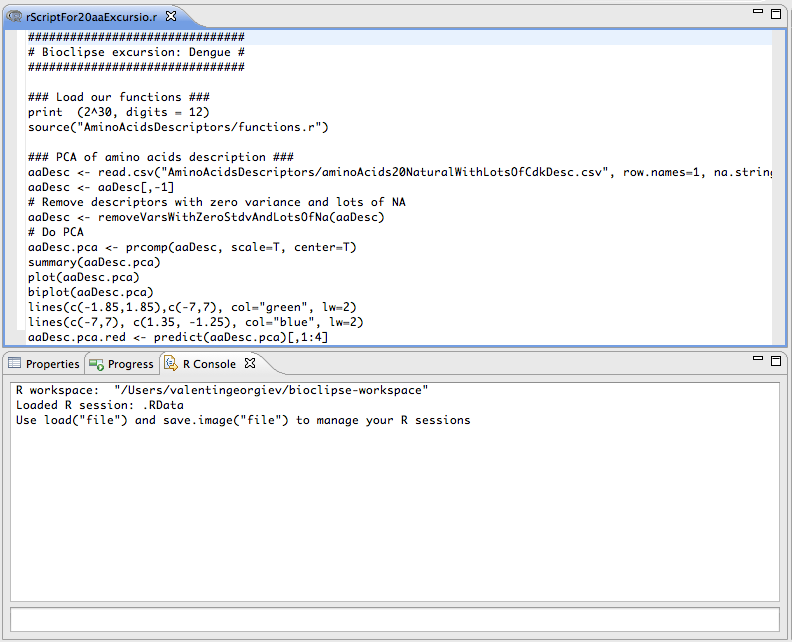
The R editor provides convenient options for working with R scripts.
A tutorial is available for Building QSAR models for virtual screening and mutagenicity predictions with Bioclipse-R. This is also the suplementary information for the article above and includes step-by-step instructions for building and deploying predictive models using Bioclipse-R, as well as a screencast for using the resulting models.
Download Bioclipse-R
Pre-built packages are available at: http://pele.farmbio.uu.se/bcr/binaries/
Alternatively, download Bioclipse and use the Install New Bioclipse Feature menu to get the latest Bioclipse-R version.
Source code
Available from https://github.com/bioclipse.
| Attachment | Size |
|---|---|
| overviewPage.png | 65.26 KB |